Polarion
|
Blog
|
Extensions
|
Forums
Search
Reports
More than 98 Extensions waiting for your Polarion.
Show all categories
Templates
Agile
Workflow
MS Office
Export & Import
Integrations
Wiki
AI
Test Automation
Reports
Featured Extension
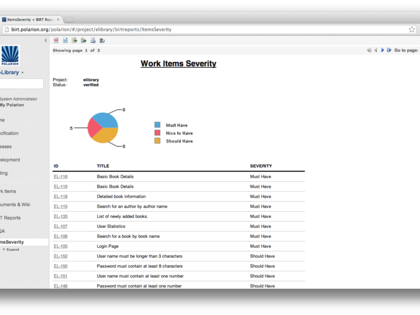
Polarion BIRT Report Viewer
Integrate BIRT Reports directly to Polarion Web User Interface.
Download
avaRegulatory: Efficient management of regulatory information & easy integration into product development
avaRegulatory includes functions for management of regulatory documents in a central regulatory library, monitor their validity, and provide easy access.
BUY for
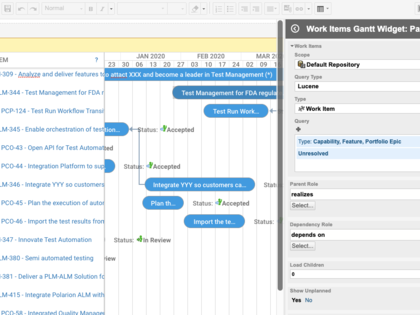
Nextedy GANTT - Manage Work Items with Gantt
Work Items Gantt brings the interactive high-level project planning & scheduling to Polarion ALM.
BUY for
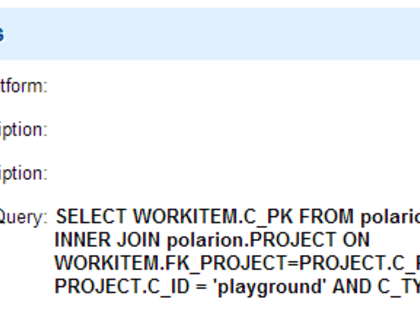
SQL Query for Test Runs
This Wiki snippet will add Test Cases to your Test Run based on a SQL query
Download
DLE tools leveraging the HTML Snippet Injector
The Polarion's Document-like Editor (DLE) can now be adjusted by injecting code snippets into the main Polarion frame.
Download
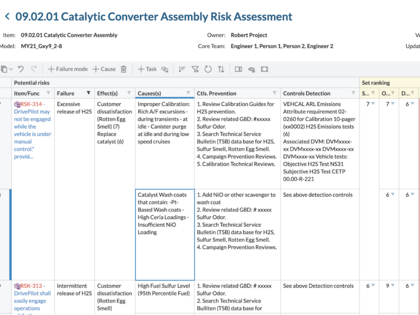
Nextedy RISKSHEET - Interactive Risk Analysis Editor
Nextedy RISKSHEET delivers the solution to manage, trace, and communicate safety-critical product risks using Hazard Analysis and/or FME(C)A directly in your Polarion ALM.
BUY for
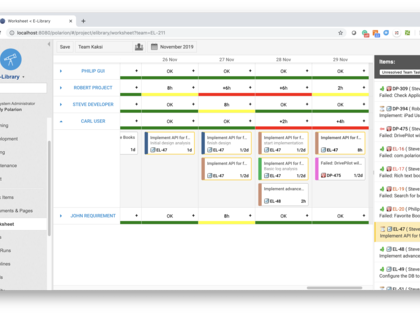
Nextedy WORKSHEET - Interactive Work Tracking
Discover quickly available resources for your project and maximize effectivity.
BUY for
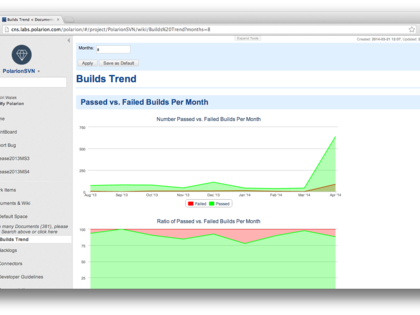
Builds Trend Report
This report displays statistics of Passed vs. Failed builds per month.
Download
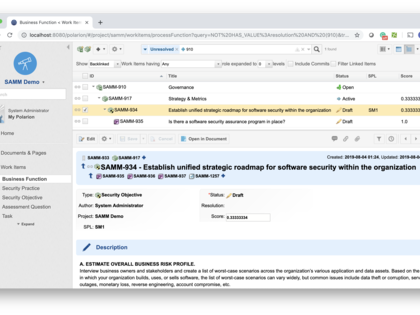
Nextedy Security Assessment Kit
Bring visibility into your software security process.
BUY for
Nextedy CHECKLIST - Actionable ToDo's on Work Item Form
Extend your Polarion Work Items with action-able checklists and stay clear on what needs to be done to satisfy your workflow process.
BUY for
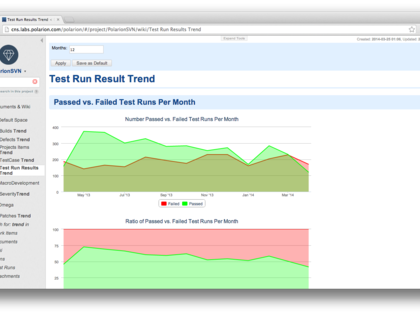
Test Run Results Trend Report
This report displays statistics of Passed vs. Failed test runs per month.
Download
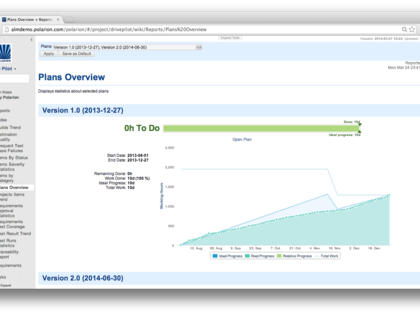
Plans Overview Report
Displays statistics about selected plans
Download
Resource Planning
Polarion Resource & Multi Project Management Extension
Download
All Reports extensions
Free & Paid
Free
Paid
For All Products
Polarion ALM
Polarion QA
Polarion REQUIREMENTS
Polarion X
Extra Widgets for Polarion® ALM™
This Polarion® ALM™ extension contains several extra widgets usable in LiveReport Pages.
RoP Cascade
Visualize the full impact of every change across your Polarion projects — trace, simulate, and manage suspect links in one interactive view.
XML-Repair
XML-Repair is a powerful maintenance and recovery extension for Polarion designed to fix broken XML files and structural inconsistencies that are difficult or impossible to repair manually through standard UI operations.
Velocity Trend Chart
Reporting widget that displays trend chart of work done, work planned and capacity of selected plans.
Example: Active Questionnaire - Create new Task
This example contains scripts necessary for configuration of a simple form that creates and configures new Tasks.
Test Run Records Management Tool
Advanced management tools for Test Run records: Remove Records, change a Record's status to "Paused", point to a different Test Case revision and create Defects.
Items by Status Report
This report displays Work Items (filtered by Work Item type) grouped by status.
Polarion Log Parser | Analyzer
A small Java tool for high-level Polarion log file analysis. It provides basic information about the log file, lists errors/exceptions, the slowest operations (TXLOGGER lines), etc.
Plans Overview Report
Displays statistics about selected plans
Gamification Framework
This extension framework allows you to introduce gamification to your Polarion environment
Custom Enumeration Factories
This plugin extends the OOTB object Enumerations (Documents, Rich Pages, Test Runs, ...) with additional ones - Work Items, Plan Templates, Repository Plans, and Test Run Templates.
Projects Fix Time Report
The report shows number of items fixed in NUM weeks after the creation for selected projects.
System Verification Test Statistics
This reports shows test and issues statistics related to system requirements
Items by Project Pie Chart Report
This report displays a pie chart with the number of Work Items in each Project, filtered by type and resolution status.
Medsoto Tool Checker
A Velocity script for Classic Wiki pages, that enables you to check the installation or the availability of variables and extensions.
Workflow Visualization
Make the workflow status of the Work Item clearly visible throughout the life-cycle, not a black box anymore.
GetPolarionProperties Library
Library for widgets and servlets allowing access to the Polarion Configuration Properties
Enumeration Factory Package
This extension provides several Work Item Enumeration Factories for single- and multi-select enumeration fields.
Intelizign - Document Tailoring
This plugin helps to manipulate and create 100% Documents out of one or more 150% Documents.
Test Run Results Trend Report
This report displays statistics of Passed vs. Failed test runs per month.
RoP Solution Flow Composer
Design, visualize, and manage solution architectures directly inside Polarion — every diagram element is a live Polarion Work Item.
Intelizign - Bulk Linking
Using a simple user interface, this plugin provides an effortless way to link a Work Item with multiple other Work Items.
avaReporting: Efficient Test Management & Traceability Analysis
avaReporting includes functions for efficient planning, execution, and documentation of tests, as well as traceability analyses.
System Monitoring and Automatic Backup
This package offers a comprehensive suite of functionalities relevant to automatic system data backup, batch user maintenance, monitoring of user operation, and data operation monitoring, all to achieve a one-stop Polarion maintenance service.
Intelizign - Document Comparator
Widget to analyze Work Items from multiple Documents side by side and identify differences and similarities.
RepositoryConfigUtil (Velocity Context Extension)
Exposes the IRepositoryConfigService and the configuration properties as java.util.Properties object to the Velocity context in LiveReport and classic wiki pages (and thus also to LiveDocs wiki content blocks).
Polarion Document Reviews by Avionyx - Workflows Your Way
Avionyx’s Document Reviews solution for Polarion streamlines compliance through checklist-driven reviews and automatic comment merging, ensuring all feedback is visible and actionable. The document under review, checklists, and comments are consolidated into a single PDF to serve as a universal source of truth.
Orphan Links
This extension can help identify and remove orphan links between Work Items.
xUnit Test Run Report
This Test Run report page displays statistics about xUnit test.
Attachment Online Preview
This extension lets you preview content online in real time without downloading attachments from the Work Item/LiveDocs Document, execute processes, save download time, and improve work efficiency.
Velocity Context Extension Package
This extension provides several helper objects to the Velocity Context in LiveReport Pages, Classic Wiki Pages, and LiveDocs Document Wiki Content Blocks.
Lucene Query Expander
This extension enhances Lucene queries by automatically expanding them based on predefined templates and configurations. It streamlines complex query building, improving traceability and usability across projects.
Defect Flow Diagram
Renders a diagram that visualizes the phase in which a defect was detected and the phase in which it was introduced. By clicking on the chart it is possible to view the corresponding defects.
WBS for ASPICE-MAN.3 Project Planning Management
Utilizing Work Breakdown Structure to manage project planning and progress and realize WIP monitoring of project tasks, responsible people, and deliverables.
Active Questionnaire
This widget renders a custom questionnaire and runs any JavaScript code on the server.
avaRisk: Ensure ISO 14971 compliance and interface consistency
avaRisk enables you to map your risk management process digitally and link it directly to the content of the interface processes.
Documentation for Polarion Project Configuration
This widget generates a report listing all the Polarion Project Configuration details.
avaUsability: Digital usability file and efficient integration into risk management and product development documentation
avaUsability includes functions to improve the usability of your products through digital documentation of usability engineering activities.
Enumeration Option Renderer
Report Pages tool for rendering referred objects
Document Baseline Panel
A document Wiki Content block that correctly lists all document baselines even when the document was moved or renamed in the past. For each baseline, the table includes the baseline name, a hyperlink to the document revision, the revision number (+ link to the LiveDocs Compare View), and the baseline time and date.
JSON-Editor
This extension provides a module that can be added to the Work Item form to visualize and process JSON data.
Polarion BIRT Report Viewer
Integrate BIRT Reports directly to Polarion Web User Interface.
Wiki Scripting Tools
Adds the Velocity tools and Polarion-specific objects to the Velocity Context of active Wiki and LiveReport pages to extend scripting possibilities.
avaRegulatory: Efficient management of regulatory information & easy integration into product development
avaRegulatory includes functions for management of regulatory documents in a central regulatory library, monitor their validity, and provide easy access.
Form Extension: Extended Linked Work Items View
This java Form Extension displays linked Work Items with the option to filter the displayed items and customize the table columns.
Nextedy GANTT - Manage Work Items with Gantt
Work Items Gantt brings the interactive high-level project planning & scheduling to Polarion ALM.
Items by Status Widget
This widget displays Work Items (filtered by Work Item type) grouped by status.
Hiding Linked WIs Icons From WI View Header
Allows hiding icons of linked work items from the header in the WI panel view (above and below title). Users can customize default visibility, fade effect, and control (checkbox) availability.
Testing Workflow & Velocity Package
This extension contains several workflow functions, workflow conditions, and Velocity Context extensions for validation and verification.
Lynxwork LynxDesigner
Seamlessly create and visualize traceability links from Polarion to any other software application - without having to synchronize any data between the systems.
Linked Work Items Pie Charts Widget
This widget renders pie charts showing details regarding the linked Work Items and linked resources of the selected Work Items.
Intelizign - Bulk Update
Using a simple user interface, this plugin provides an effortless way to update a set of Work Items.
Requirements-Inspector
This Requirements-Inspector extension is used to grade Work Items.
Pages Agile KANBAN Board Widget
KANBAN board for use on Polarion report Pages
Sentence Template for Requirements (Satzschablone)
This extension is intended to assist in formulating requirements according to the IREB standard.
Projects Items Trend Report
This report aggregates trend charts of reported work item from selected projects (filtered by custom query).
SQL Query for Test Runs
This Wiki snippet will add Test Cases to your Test Run based on a SQL query
Diff-Tool
A diff tool for Polarion including merge functionality of reused documents
Navigation Panel
Project Explorer for your Report Pages
Drawing Diagrams on the Work Item Form Extension Panels
This extension utilizes the HighCharts engine to draw diagrams as part of the Work Item form.
DLE tools leveraging the HTML Snippet Injector
The Polarion's Document-like Editor (DLE) can now be adjusted by injecting code snippets into the main Polarion frame.
Items by Enumeration
This widget counts the number of work items assigned to the possible selections of a selected enumeration type.
Graphical and Tabular Impact Analysis Widget
This widget is used to analyze the impact of a change by viewing the parents and children of a specific Work Item in a graphical or tabular format.
Nextedy RISKSHEET - Interactive Risk Analysis Editor
Nextedy RISKSHEET delivers the solution to manage, trace, and communicate safety-critical product risks using Hazard Analysis and/or FME(C)A directly in your Polarion ALM.
Nextedy WORKSHEET - Interactive Work Tracking
Discover quickly available resources for your project and maximize effectivity.
Builds Trend Report
This report displays statistics of Passed vs. Failed builds per month.
Nextedy PLANNINGBOARD
Control your release or sprint assignments with ease.
Nextedy LIVEPLAN
Backward compatible reimplementation of the retired Polarion LivePlan.
Nextedy Security Assessment Kit
Bring visibility into your software security process.
Multilevel Traceability Widget
This widget can be configured to display a Multilevel Traceability Table including Work Item fields, Resources (source code) and latest Test Execution results.
Affected Change Objects Enhancement for ASPICE-SUP.10 Change Request
Establish bi-directional traceability between Change Requests and affected Work Items, Documents, and the code. Record the versions of the affected Change Objects before and after the change.
Nextedy CHECKLIST - Actionable ToDo's on Work Item Form
Extend your Polarion Work Items with action-able checklists and stay clear on what needs to be done to satisfy your workflow process.
RoP Fault Tree Composer
Perform standards-based Fault Tree Analysis directly inside Polarion — build, validate, and trace fault trees where your engineering data already lives.
Polarion Log Viewer by Avionyx - Easier Log Analysis and Management
Easily view Polarion server logs without requiring system-level access. Browse, search, download, and clean up, all through the Polarion user interface.
Work Item Calendar
Render Work Items on the Gregorian Calendar
Polarion Notification Bar leveraging the HTML Snippet Injector
The interface of Polarion can now be adjusted by injecting code snippets to the main Polarion frame.
Test Result Pie Charts Widget
This widget renders pie charts showing details regarding the test execution status and further properties of the test Work Items.
Simple Traceability Diagrams by Avionyx - Visualize Work Item Relationships Instantly
Polarion Simple Traceability Diagrams by Avionyx renders a clear, graphical view of any Work Item's Back Links and Forward Links — directly inside the Polarion form view.
RoP RefSense
Automatically detect references in Polarion Work Item text and link with a single click — with a companion widget to review invalid and suggested references.
reQlab – AI-Powered Requirements Validation Tool | On-Premise & GDPR-Compliant
reQlab is your AI assistant for automated requirements validation and natural language processing. It flags vague language, contradictions, and redundancies based on industry standards - improving clarity and reducing rework.
Intelizign Workflow Viewer 2.0
Displays interactive workflow graphs with status, transitions, and signers—replacing tables for clearer visualization and streamlined workflow navigation.
Teamscale - Lightweight Requirements Tracing
Lightweight Requirements Tracing: Teamscale helps to continuously keep requirements, design, code, and tests in sync in an agile fashion.
Polarion – GitLab Bridge
This kit allows to create Issue objects in GitLab and display the information back in Polarion.
Assigned Work Widget
This widget is used to analyze a set of work items to list assignees and their assigned work
Example: Graphviz - Rendering using viz.js
Graph Visualization Software graph rendering in Polarion
Medsoto Configuration Viewer
The Medsoto Configuration Viewer displays a detailed summary of the configurations of the current project.
Chart Switcher Widget
Choose what kind of chart you want to visualize in LiveReports
Stacked Bar Chart
Stacked Trend Chart of your Polarion Data
3 Level Traceability Widget
This widget displays a 3 Level Traceability table
2 Level Test Execution Table
2 Level trace table with test execution details
2 Level Traceability Widget
This widget displays a 2 Level Traceability table
Resource Planning
Polarion Resource & Multi Project Management Extension
Stacked Run Chart Widget
Show a stacked bar chart of your Test Run data
Polarion RPC Database Appender
Enable logging your RPC statistics in MySQL Database
3 Level Traceability Widget with Test Records
This widget displays a 3 Level Traceability table where the third column displays the test records from the last execution.
TraceTool
TraceTool allows you to search and analyze traceability independent of link depth. For example, you can find all Requirements which have some defects indirectly linked.
Scalable, Nested, Graphical Gantt Project Plan
A WiKi page showing Polarion live plan as common Gantt diagram. Tasks are sorted by parent relations and start date. They are hierarchically nested and the depth can be dynamically changed. The planned duration from the live plan is used to show scaled graphical bars so that one page fills the complete project plan. Summary tasks are rendered black/italic. Date ranges and time points can be set via the UI and you can change the scale dynamically.
Time Tracking Report
This report should give every user some information on how much time they already worked in the current week or month to check their workload. A Project Manager has another view to see the workload of all project members.