Rationale
In order to continuously optimize the development and quality assurance processes, measurement is one crucial ingredient. The overall objective of measurement is to deliver relevant information for quality management needs. For example, information is needed to identify defect detection activities through which many (types of) defects slip or to identify those techniques with high defect detection potential.
Defects carry a lot of information that can be measured and analyzed in order to improve the development process and quality assurance process. Thus, the central element of a quality measurement program is a useful and easy-to-apply defect classification scheme. There are a variety of defect classification schemes that have been successfully used for different measurement purposes. Most prominent are the Hewlett-Packard Scheme and the Orthogonal Defect Classification (ODC) scheme from IBM. Even though these schemes are successful in a specific context, it seems to be difficult to apply the techniques in other companies’ context. This is especially true if the type of documents and defects considered differ from traditional ones. Therefore it is essential to customize defect classification to the special environment and its measurement goals to apply it successfully.
Fraunhofer IESE has developed an approach to define, introduce, and validate a customized defect classification scheme. The objective of the approach is the deduction of a defect flow model (DFM), which allows characterizing the number of injected defects, the number of detected defects, and the number and type of those defects detected or not detected in a given quality assurance process. In order to successfully define such defect flow models for a given context, the presented approach aims at combining the expertise from measurement experts and the domain knowledge from developers in the course of an interview-based approach.
The DFM approach has been applied successfully in many industrial projects. Large companies such as Bosch apply the approach throughout the organization. However, medium-sized companies like IBS AG also apply DFM successfully to optimize their software development and quality assurance processes.
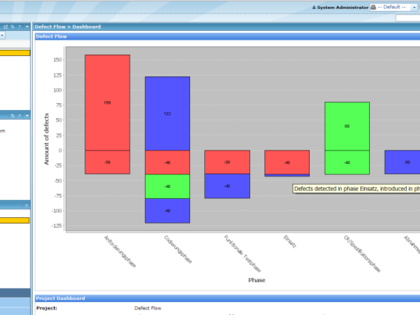
Explanation of the chart
Defects are visualized as bars for each phase. Positive numbers indicate introduced defects, negative numbers detected defects. The colors of the segments of the bars correspond to the introduction phase of the defect.
Installation
- Stop Polarion server.
- Extract com.polarion.alm.extensions.defectflow_1.0.1.zip to [Polarion installation]/polarion/plugins.
- Start Polarion server.
Usage
The chart can be embedded into a Wiki page, on the dashboard or it can be used as standalone page. This is done by using an URL that also contains the configuration of the chart.The URL has the following form:
http://<polarion server>/polarion/lcqm/chart.jsp?phaseEnum=<phase enum id>&project=<project id>&introducedField=<introduced field>&detectedField=<detected field>&sizeX=<width>&sizeY=<height>.
Replace the values inside <> with values that correspond to your configuration.
- <phase enum id>: The id of the enumeration you used to define the project phases. Example: If you defined a phase-enum.xml the parameter would be phase.
- <project id>: The id of the project that contains the defects you want to create the chart for.
- <introduced field>: The id of the field that contains the phase the defect was introduced.
- <detected field>: The id of the field that contains the phase the defect was detected.
- <width>: Width of the chart in pixels.
- <height>: Height of the chart in pixels.
Using the URL directly
Just open the URL that you get by replacing all parameters in the browser and you should see the chart. You should always do that before attempting to use the URL inside the Wiki or the Dashboard to verify that it works.
Embedding into the Wiki
Just add following html code to the Wiki page:
<iframe src="<url>" width="<width + x>px" height="<height + y>px"></iframe>
Replace
- <url>: the URL you use to view the chart.
- <width + x>: If you don't want a scrollbar on the iframe use a value a little bit higher than <width> in your URL.
- <heigth + y>: If you don't want a scrollbar on the iframe use a value a little bit higher than <height> in your URL.
Embedding on the dashboard
The IFramePortlet can be used to embed the chart on the dashboard. Add following section to you dashboard.psml:<fragment id="defect.flow" type="portlet" name="webui::IFramePortlet"> <property name="row" value="0"/> <property name="column" value="0"/> <property name="layoutData" value="colspan='2' style='width:100%'" /> <preference name="url"> <value><escaped url></value> </preference> <preference name="title"> <value>Defect Flow</value> </preference> <preference name="height"> <value><height + y></value> </preference></fragment>
The yellow part has to be adjusted to make fit the fragment in your dashboard.psml and won't be explained further here.Parameters that have to be replaced are:
- <escaped url>: The URL you use to access the chart directly with all & replaced by & .
- <height + y>: A value a little bit higher than <height> in your URL.
Mapped phase assignment
Probably <introduced/detected field> doesn't contain the phase directly, and some kind of mapping is required to find out the detection/introduction phase. Such a mapping is possible by specifying additional attribute for the option elements in your phase enumeration.
Example:
<option id="Anforderungsphase" name="Anforderungsphase" description="" sortOrder="1" introduced="pflichtenheft,regressiontest" detected="kunden_workshop"/>
If <introduced field> contains "pflichtenheft" or "regressionstest" the option will be used as introduction phase. If <detection field> contains "kunden_workshop" the phase will be used as detection phase.

