
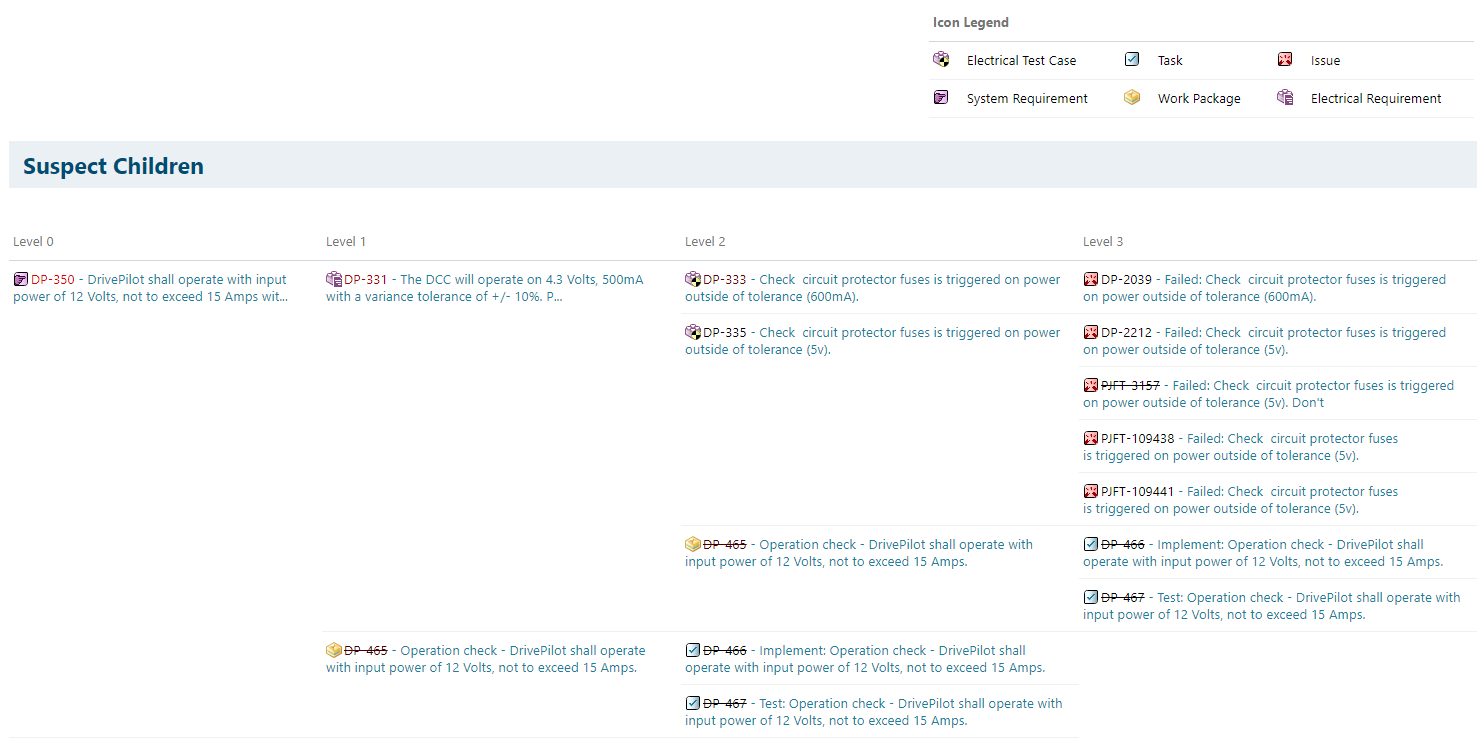


This widget can be used to analyze the impact of a change by viewing the parents and children of a specific Work Item in a graphical or tabular format.
This extension delivers a reporting widget that can be installed to your global or project widget library.
Instructions
- Download the extension
- Unpack the zip file
- follow README txt
Main Features
- Allow a user to specify a Work Item ID or Title for generating a impact analysis tree or table
- Autocomplete of ID or Title can be configured (starts the autocompletion after writing 2 characters)
- Analysis can be filtered by link roles
- Link roles can be colored (in graphical tree view)
- Direction of the analysis and display can be configured
- Depth of trace can be configured (up to 20 levels)
- Size of graphical tree canvas can be specified
- User zoom behaviour can be configured (from root node or position of mouse cursor) in the graphical tree view
- Icon legend can be displayed (Table and Graphical Tree view)
- User configurable parameters to be shown in the report can be specified
- Export Tree to .svg
Known Limitation:
- Print to PDF and HTML cannot be used