This extension is related to the Classic Wiki technology that is now outdated and replaced by our new LivePage format. We still maintain Classic Wiki but we are no longer extending its feature set.
Please consider implementing the use case you are looking for using a LivePage.
Please consider implementing the use case you are looking for using a LivePage.
Features:
- Wiki macro, which could be copied in any wiki page
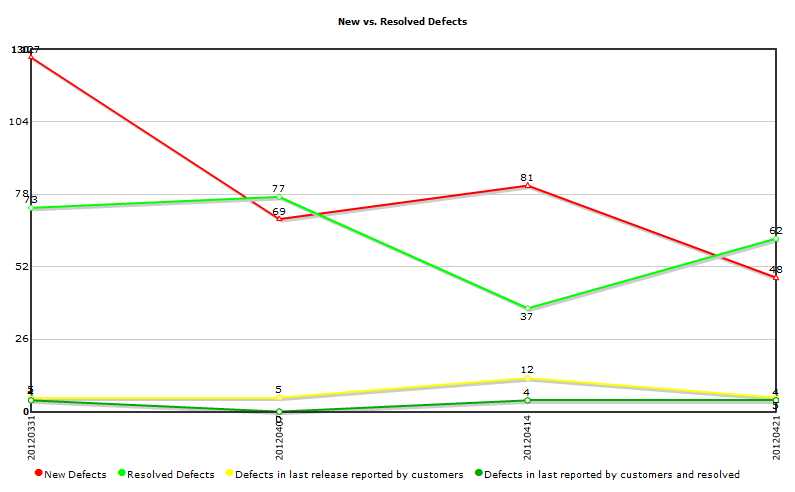
- Allows very quickly to compose a trend chart for created and/or resolved items in last N-weeks
Installation:
- Copy content of trendchart.txt in your wiki page
- Adjust configuraiton of the $lines variable definition
- Short documentation and example of the macro is provided directly in the code
Example of use:
#set ($queries = [])
#set ($return = $queries.add(["New Defects", "project.id:MyProject AND type:defect", false, "FF0000"]))
#set ($return = $queries.add(["Resolved Defects", "project.id:MyProject AND type:defect", true, "00FF00"]))
#set ($return = $queries.add(["Defects in last release reported by customers", "project.id:MyProject AND type:defect AND occuredInBuild:6.* AND CUSTOM_FIELDS:customer", false, "FFFF00"]))
#set ($return = $queries.add(["Defects in last reported by customers and resolved", "project.id:MyProject AND type:defect AND occuredInBuild:6.* AND CUSTOM_FIELDS:customer", true, "00AA00"]))
#wiTrendChart("New vs. Resolved Defects" 800 500 $queries 4)